|
To get a more accurate picture of employment trends in the field, the AAR expanded our data collection efforts by creating a Web-based, anonymous survey to track hirings by specialization and to collect demographic information on job candidates.
In spring 2010, surveys were sent to all candidates who registered for the 2009 Annual Meeting Job Center in Montréal, Québec, and to all employers who had advertised a position in Job Postings in 2009. Presented here are highlights of the data received. Complete results can be found here.
Employer Data
Out of 240 employer solicitations, 59 responses were received (25 percent response rate). Eighty-six percent of those who responded filled the position, which they had advertised in Job Postings. Of the 51 positions filled, 26 percent of the employers report interviewing the appointee at the Job Center. The majority of the positions filled were at the assistant professor level (66 percent), followed by associate professor (8 percent), visiting professor (8 percent), full (8 percent), instructor (2 percent), with 8 percent of the positions ranked as “other.” None of the reported filled positions were ranked at the lecturer level. Sixty-one percent of the positions were tenure-track, 20 percent were non-tenure-track or term contract, 12 percent were tenured, 3 percent were reported as limited, 2 percent were adjunct, and 2 percent were ranked as “other.” Forty-nine percent of the appointees were male; 51 percent were female. The racial/ethnic distribution of the appointees was as follows: 74 percent Caucasian or Euro-American, 10 percent reported “other,” 8 percent African American or black, 4 percent Asian or Pacific Islander, and 4 percent multiracial. None reported Latina/o or Hispanic, American Indian or Alaska Native.

Candidate Data
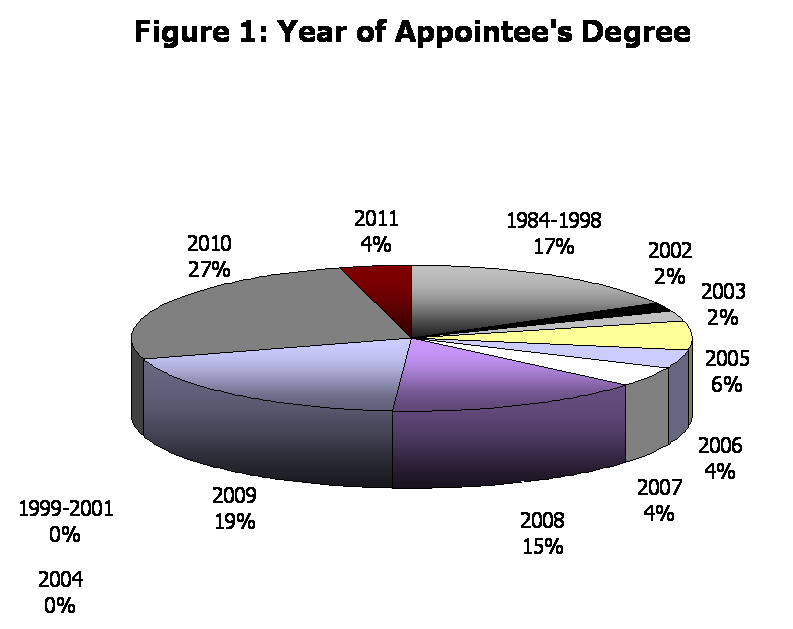
Out of 462 candidate solicitations, 149 responses were received (32 percent response rate). When asked to indicate employment status during the search, 52 percent reported being a graduate student, 36 percent reported part-time/adjunct faculty status, 13 percent reported full-time/non-tenure-track faculty, and 13 percent reported teaching assistant status [candidates could select more than one response]. Seventy-one percent held a PhD or planned to have the degree completed by August 2010, while 15 percent would be ABD going into fall 2010.
Job Offers
Of the 149 candidates who responded, 29 percent received one or more job offers. Of those, 83 percent received one offer, 15 percent received two offers, 2 percent received three offers. None reported receiving more than three offers.

Position Data
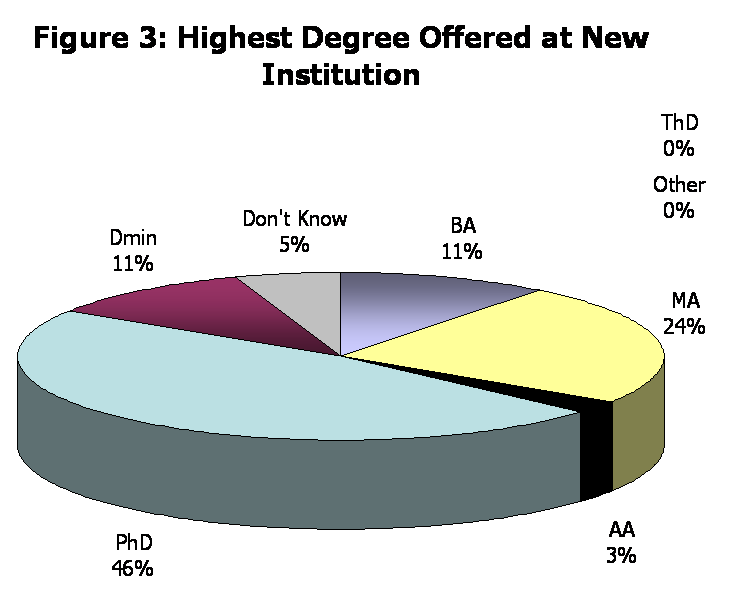
Of the 41 candidates who accepted an offer, 37 percent will work in a private college/university, 37 percent will work in a public college/university, 13 percent will work in a church related college, and 10 percent will work in a free-standing seminary. Three percent reported that they will work in an institution classified as “other.” None reported that they will work in a university-related divinity school. Forty-five percent will work as full-time/tenure-track faculty, 39 percent as full-time/non-tenure-track faculty, 8 percent as part-time/adjunct faculty, and 3 percent as administration. Five percent reported “other.” None reported working as full-time tenured faculty.
Of the 41 candidates who accepted positions, 58 percent report being thrilled with the new position, 39 percent report feeling satisfied with the position, and 3 percent report feeling unsatisfied. None report feeling deeply unhappy about the position.


Candidate Demographics
Sixty-two percent of the candidates who registered for the 2009 Job Center were male; 38 percent were female. Regarding race/ethnicity, 84 percent of the registrants reported their race/ethnicity as Caucasian or Euro-American, 5 percent Asian or Pacific Islander, 3 percent Latina/o or Hispanic, 3 percent multiracial, 3 percent “other,” and 2 percent African American or Black. None reported American Indian or Alaskan Native. In terms of citizenship, 80 percent were United States citizens, 10 percent were citizens of Canada, 5 percent were non-citizen residents of the United States, and 5 percent reported their citizenship as “other.” None reported their citizenship as non-citizen residents of Canada.
Job Search Experience
Ninety-six percent of responding candidates reported that interviewers did not exhibit unprofessional or inappropriate behavior. Those that did encounter such behavior reported the type of behavior as “other” than the choices provided: offensive remarks, offensive actions, excessive use of alcohol during interview and use of a hotel bedroom for interview.
Eighty-eight percent of candidates report that interviewers did not ask questions or broach topics of an inappropriate nature. Of those who did encounter such questions/topics, the three most common were in regards to marital status, partner's careers, and religion. Sixty-one percent reported that the interviewer directly asked an inappropriate question. Fifteen percent stated the interviewer indirectly broached an inappropriate topic. Seventy-one percent of the respondents answered the question truthfully, while 7 percent changed the topic in order to avoid the question and 7 percent refused to answer. Forty-six percent reported that they believed their response to the question was to their disadvantage. Another 46 percent reported that they were not sure whether their response was to their advantage or disadvantage. Eight percent believe their answer was to their advantage.
|
![PDF-NOTE: Internet Explorer Users, right click the PDF Icon and choose [save target as] if you are experiencing problems with clicking.](http://rsnonline.org/templates/rsntemplate-smallmasthead/images/pdf_button.png)


